Data analysis for busy investors
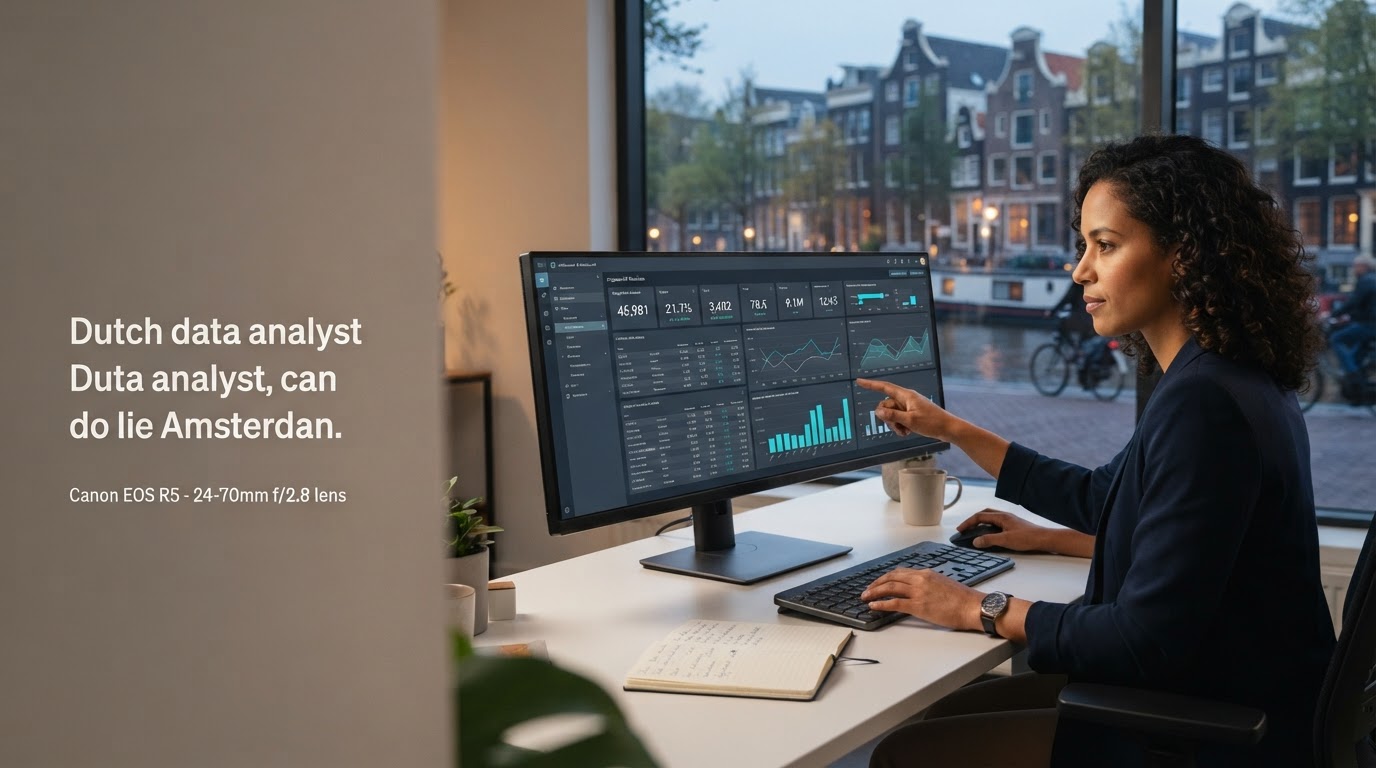
Baatelheid collects price, volume and risk data from multiple exchanges in one consolidated dashboard, so you make decisions based on current signals instead of separate tabs.
Consolidated overview
Many private investors have positions spread across multiple platforms and log in separately every day to get an idea of their total position. Baatelheid links these platforms via secure, read-only connections and displays the aggregated numbers in one place.
This way you can see at a glance how your portfolio as a whole is performing, without having to retype or compare data from different environments.
Predictive models
Baatelheid's models are trained to recognize patterns in market data that are difficult for an individual investor to see within a limited amount of time. The result is not a guarantee of return, but a more substantiated view of risk and timing.
Each linked position is given a risk indication based on volatility, liquidity and concentration within the portfolio, so you can see where your exposure is greatest.
Deviations in volume, price movement or order book depth are continuously recalculated, so that important shifts are visible without you having to follow charts yourself.
Not every price movement is relevant. The model filters short-term fluctuations from the signals, so that you only see notifications that match your set focus areas.
Method
The design has been deliberately kept simple, because the target group of Baatelheid usually has little time for daily portfolio management.
You connect your existing accounts at the supported exchanges via a read-only link. This allows Baatelheid to view positions, but never execute transactions itself.
The models process historical and current market data and translate this into risk indications and signals per position, updated as new data arrives.
You will receive an overview of points of interest and can decide for yourself which adjustments suit your situation, without requiring daily follow-up.
Transparency
The overview below shows which data is included in the analysis and how often it is updated.
| Data source | Type of signal | Update frequency |
|---|---|---|
| Price & volume | Trend and volatility analysis | Continuous |
| Order book depth | Liquidity risk | Continuous |
| Portfolio concentration | Risk spreading | With every synchronization |
| Historical correlations | Scenario indication | Daily |
| Market sentiment | Context for signals | Daily |
Frequently asked questions
Links to exchanges are via read-only API access. Baatelheid can therefore view positions and market data, but has no rights to make withdrawals or place orders on your behalf.
The connection and settings are configured once. After that, a short time per week is usually sufficient to review the overview and signals, instead of consulting multiple platforms every day.
The models are based on historical and current market data and provide a risk assessment, not a guarantee of results. Signals are intended to support your own assessment, not as a replacement for financial advice.
Start linking your accounts and see a first consolidated view of your positions and risks in minutes.